An Alert Without a Next Step Is Just Noise
It’s 2am. The alert fires. The on-call is awake, phone in hand. Now what?
If the answer is “check the dashboard” or “look at the logs” or “figure out what’s going on”, the alert isn’t finished. Notifying someone is easy. Telling them what to do is the hard part. Everything between the page and the fix depends on what the engineer can find in five minutes, under stress, squinting at a small screen.
The alert body isn’t metadata. It’s the first page of the runbook. Write it that way.
The Four Questions Every Alert Must Answer
A good alert answers four questions before the on-call even asks them.
What’s broken? Not the rule name. “ErrorRateHigh” tells you nothing. Which service, which operation, what user-facing behaviour is actually degraded? “Checkout service: payment processing errors at 8.3%, against a 1% error budget (99% SLO). About 420 users a minute affected.”
How fast is it getting worse? That’s the burn rate: how fast you’re spending the error budget compared with the pace that would last exactly the month. “Burn rate 8.3×. 23% of this month’s budget is gone, and the rest runs out in about 67 hours at this pace.” That number decides whether you wake the team now or wait for the morning.
What’s already been checked? The alerting system can attach context automatically: recent deployments, related alerts, whether this has happened before and how it was fixed. Not a list of dashboards to open. Curated context, delivered before the engineer forms a theory.
What are the first three steps? Give the runbook link and the exact place to start. Not “see runbook”. Instead: “Runbook: payment-processing-errors, section 3: gateway timeout diagnosis.”
Same alert, two designs: the lane that ships a next step, and the bare notification most teams send today.
Copy-paste version: the alert body template.
Before and After: Same Incident, Different Alert Bodies
Here’s the difference good design makes. The same underlying condition, a raised error rate in the payment service, written two ways.
❌ The notification (what most teams have):
FIRING: PaymentServiceErrorRateHigh
Severity: P1
Value: 8.3%
Threshold: 1%
Service: payment-api
Dashboard: https://grafana.example.com/d/payment
✅ The alert (what it should be):
[P1] PAYMENT SERVICE DEGRADED: checkout error budget burning at 8.3x

Impact: ~420 users/minute experiencing payment failures
SLO status: Monthly error budget 23% consumed, exhausted in ~67h at current burn
First seen: 02:14 UTC (11 minutes ago)

Recent changes:
  - payment-api v2.4.1 deployed 02:08 UTC (6 min before incident start)
  - No other services currently alerting

First steps:
  1. Check deployment health: kubectl rollout status deploy/payment-api
  2. If recent deploy is the cause: kubectl rollout undo deploy/payment-api
  3. If no obvious cause: Runbook → payment-errors → section 3 (gateway timeouts)

Runbook: https://runbooks.example.com/payment-errors#section-3
Trace sample: https://jaeger.example.com/trace/abc123def456
The second version does more than say something’s wrong. It shows the blast radius, the time pressure, the likely cause (a deployment six minutes earlier) and the first command to run. An engineer who’s never seen this alert can start diagnosing straight away.
SLO Context Isn’t Decoration
Burn rate and time until the budget runs out aren’t extras. They’re the main decision tools for whoever gets paged.
A P1 burning at 14× drains a month’s budget in about two days, so you escalate now. The same P1 at 2× leaves roughly two weeks of budget. It’s urgent, but you don’t need to wake the backend lead at 2am. Without the burn rate in the alert, the engineer has to go and look it up before deciding anything, and that’s time they don’t have.
Showing a few time windows side by side in the alert body turns the burn rate into a quick diagnosis:
The 1-hour window says it’s happening now and fast enough to page. The 6-hour window says whether it’s sustained or a fresh spike. The 24-hour window says whether this is new or has been building since before your shift. A 24-hour window that’s high on its own, with the short windows calm, is a slow burn: a ticket, not a page.
That’s a diagnostic view for the human, not the alerting rule itself. For the rule, the Google SRE Workbook’s approach pairs each long window with a short one: page when the burn rate is over 14.4× across both the last hour and the last 5 minutes, or over 6× across both the last 6 hours and the last 30 minutes. The long window proves it matters. The short one proves it’s still happening, so the alert clears soon after you fix it.
The Alert Lifecycle: From Creation to Retirement
Most teams put their effort into creating alerts. Few think about retiring them. The result is alert configs that pile up: rules for incidents from two years ago, thresholds set during a scaling crisis that are now permanently breached, and duplicates from different monitoring systems that nobody cleaned up.
The review questions are simple. What share of alerts led to real action? Did the engineer follow the runbook link or ignore it? Was the context enough, or did they have to go hunting? An alert that gets acknowledged and closed without action fails the “next step” test. It notifies, but it doesn’t inform.
Measuring Whether Your Alerts Are Working
Four numbers tell you most of what you need to know about alert quality.
Time to acknowledge shows whether the paging path works and whether engineers trust the alert. A long time to acknowledge on a P1 means something’s broken.
False-positive rate is the share of firings nobody acted on. As a rule of thumb, once more than one in five firings of an alert needs no action, you’re training your team to ignore it. Past half, delete it and start again. For your alert set as a whole, Alert Fatigue Is an Observability Problem puts the bar at 70% actionable over 30 days.
Time to resolution for incidents an alert found, against those found some other way. If alert-found incidents take longer, the alert isn’t giving useful context when it counts.
Runbook follow rate: did the on-call click the runbook link? If not, either the runbook isn’t useful or the alert body already said enough to act. Both are worth knowing.
The Connection to the Broader Model
An alert with SLO context, burn rate and blast radius isn’t just a nicer experience for the on-call. It reflects a different model: observability as a system that tells you what’s happening to users, not just which thresholds got crossed.
The question “is this alert actionable?” is really asking “do I understand what this condition means for my users?” If you can’t write the first-three-steps section, you haven’t traced the path from metric to user experience. The alert body is where you prove you have.
Write your alerts as letters to your future self at 2am.
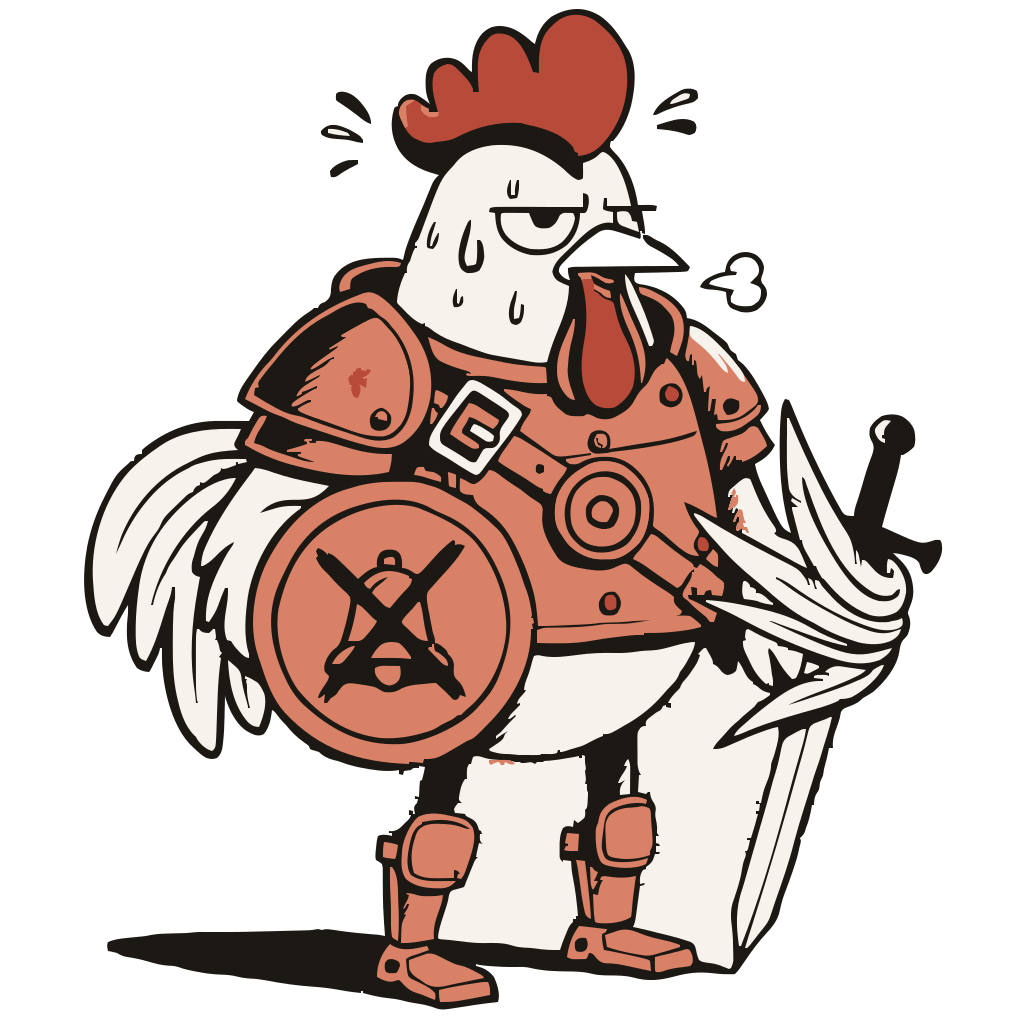
An alert that wakes me with no next step? I draw my sword and charge into the dashboard. ...the sword does not help without a runbook, but it FEELS proactive.
One observability idea, every Tuesday
A short take, one thing to try that week, and a link to the full article. No vendor pitches.
Subscribe on Substack